DSP Tools
We used multiple DSP tools from inside the classroom and some that we didn't learn in the classroom. The skills learned in and out of class allowed for the realization of this project, and some of the methods of digital processing are discussed below.
Moving Average Filter
The moving average filter is a linear signal processing tool used to remove “impulsive” noise. It functions by windowing the signal at a point and its surrounding points and taking the average of those points. The window then moves onto another data point and repeats the process until every point has been averaged.
This function was used in the MATLAB version of the pitch detection algorithm to remove noise from the “pitch” function found in the audio toolbox. The noise is typically very short, allowing for the use of this function without much error.
Fast Fourier Transform (FFT)
An FFT (Fast Fourier Transform) is a faster, computer-centric Discrete Fourier Transform function. Its importance stems from its ability to quickly and reliably transform data to the Fourier basis.
The FFT is practically used in every step of the final project. As notes are a set of pitches, the FFT allows for analysis of these pitches. An example of its application is inside the pitch detection algorithm. Every note, whether it originates from a drum or piano, has a fundamental frequency followed by several harmonic frequencies explained here. Using this knowledge, the Fourier transform of the original sound file can be used to find the fundamental frequencies. However, as the song has many, many notes and the FFT of the entire song would give the magnitudes and frequencies of all notes in the song. To circumvent this, windows of the song are taken, transformed, and then analyzed. Analysis of the notes, in its most basic form, would look for the most dominant frequency, which correlates with the fundamental frequency of the note to determine that note (A, B, C, etc) in that specific amount of time.
Spectrogram
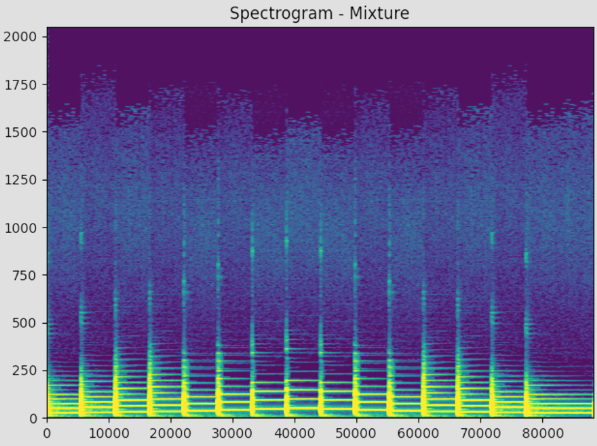
A spectrogram is a visual method of analyzing the frequencies of any file array. It behaves by windowing the original data array at any one point in time, taking the discrete Fourier transform, and plotting the result. This is then repeated for every window length until it reaches the end of the data and appends any additional plot to the right of the previous. This time, however, frequencies are plotted on the y-axis and the color of the graph corresponds to the magnitude of the frequency.
The spectrogram’s general purpose was the testing, validation, and presentation of data to the user. It assists with communicating the difference in what sounds different instruments make or how strong the harmonics are compared to the fundamental frequency. Namely, a few examples show that a note has the largest magnitude at its fundamental frequency and drums have very impulsive sounds that span a large range of frequencies. Attached is the spectrogram of the C-Major scale.
Neural Networks
See this page for an in-depth explanation of a CNN. In this project, there is more than just one Convolutional Neural Network.
Hybrid DEMUCS
The first CNN is the music splitter. The model used is the Hybrid Demucs found here. This music splitter does as its name implies- when given an input of a music file, it can output 4 stems of the song correlating to the vocals, drums, bass, and other parts - other being, for example, piano. These stems are essentially what that part of the song would sound like if all the other parts were removed. This model comes pre-trained with its own weights. It is trained using the MUSDB-18 dataset and can be applied to almost any song genre.
The Hybrid Demucs used in this project is pivotal in the music to transcription as pitch detection algorithms can’t work with muddy signals or with too many instruments at once. This neural network removes ambiguity from the original song and allows for more accuracy in later stages. As the main goal is that whole songs can be inputs to the project, this neural network is necessary for this reason. The output of this function can then be directly plugged into a pitch detection algorithm, of which there are many to choose from.
Basic Pitch
Basic Pitch is another Convolutional Neural Network that can be utilized to transcribe audio files into MIDI files. Developed by the same company behind Spotify, this neural network can reliably predict what note/s is being played in a song. Unlike simpler models, this model can differentiate between polyphonic notes, making it an invaluable tool in pitch detection. Unfortunately, it’s not perfect. Pitch detection is still a research area even after 40 years as harmonics can add to create a confusing mess any algorithm tries to decode. It functions variably depending on the input- it works best with guitars and less so with synthesizers. This is also a very user-centric model. Other DEMUCS trained specifically for one instrument tend to perform better on average, but this model attempts to do it all -many instruments, polyphony, pitch bending, and all in a reasonable amount of time.
Basic-Pitch is used in this project as one of the three options for pitch detection and transcription. Basic-Pitch can be installed as a library in Python and can work with just a single function call. The model comes pre-trained unless the user intends to train it themselves. The input to this function is one of the stems from the music splitter, which then outputs the MIDI file- the transcribed piece of music.